How to Calculate Standard Deviation in Excel by Using Its Excel Formulas & Functions
Home >> Excel Tutorials from Compute Expert >> Excel Calculations >> How to Calculate Standard Deviation in Excel by Using Its Excel Formulas & Functions


In this tutorial, you will learn how to calculate standard deviation in excel by using various formulas. We will also explore how to calculate other statistic variables in excel related to standard deviation.
We will start by learning about the standard deviation term first generally. After that, we will learn the methods in excel to calculate the standard deviation for population and sample data. Next, after getting the basics, we will discuss more advanced standard deviation calculations we can do in excel.
Want to master them all so you can be much more proficient in processing statistic data in excel? Read all parts of this tutorial!
Disclaimer: This post may contain affiliate links from which we earn commission from qualifying purchases/actions at no additional cost for you. Learn more
Want to work faster and easier in Excel? Install and use Excel add-ins! Read this article to know the best Excel add-ins to use according to us!
Table of Contents:
- What is a standard deviation?
- How to calculate standard deviation generally
- List of standard deviation formulas in excel
- How to use standard deviation formulas in excel to calculate the standard deviation from population data
- How to use standard deviation formulas in excel to calculate the standard deviation from sample data
- How to calculate weighted standard deviation in excel
- How to calculate standard deviation in excel with an IF criteria
- How to calculate the standard error of the mean in excel
- Excel variance calculation & formulas
- Exercise
- Additional note
Why We Need to Learn About How to Calculate Standard Deviation in Excel?
Standard deviation, often abbreviated as SD, is a number that represents the measure of our data distribution spread. The larger the standard deviation that we have means the further distributed our data is from their mean. That also means the more variation we have in our data.There is no good or bad standard deviation number set in stone. It all depends on how diverse we expect our data to be. If our standard deviation matches our expectation, then it should be all good.
How to Calculate Standard Deviation Generally in Excel?
As standard deviation measures our data distance against the mean, we include the mean too when we calculate the standard deviation. The general formula for a standard deviation calculation is as follows.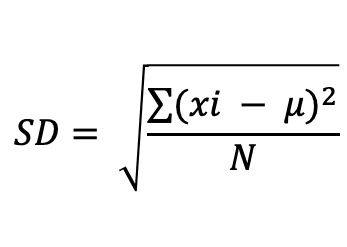
We sum all the squared subtraction between each data value and its mean before we divide it with the data size. After that, we calculate the square root of the division result to get our standard deviation value.
Can we write this calculation manually in excel? Yes, we can surely do that. However, it can take much time to do the writing.
We should use a built-in excel formula to calculate our standard deviation instead. There are some excel formulas we can use for the calculation, as you can see yourself in the next part.
List of Standard Deviation Formulas in Excel
There are six formulas you can use to calculate a normal standard deviation in excel. You can see what are those six and their brief description below.- STDEV: the formula to calculate the standard deviation of sample data by ignoring logical values or text if there is any.
- STDEV.S: the formula to calculate the standard deviation of sample data by ignoring logical values or text if there is any. This is the newer version of the STDEV formula in excel (you can use it since excel 2010). They seem to have a similar function although excel officially recommends using STDEV.S instead of STDEV.
- STDEVP: the formula to calculate the standard deviation of population data by ignoring logical values or text if there is any.
- STDEV.P: the formula to calculate the standard deviation of population data by ignoring logical values or text if there is any. This is the newer version of STDEVP (you can use it since excel 2010). They seem to have a similar function although excel officially recommends using STDEV.P instead of STDEVP.
- STDEVA: the formula to calculate the standard deviation of sample data by also involving logical values or text if there is any. STDEVA assumes FALSE logic values and text as 0 and TRUE logic values as 1.
- STDEVPA: the formula to calculate the standard deviation of population data by also involving logical values or text if there is any. STDEVPA also assumes FALSE logic values and text as 0 and TRUE logic values as 1.
As you can see from the description, you should choose to use one formula depending on your data type (population/sample). You should also choose the formula according to whether you want to ignore/involve logic values and text in your calculation.
How to Use Standard Deviation Formulas in Excel to Calculate the Standard Deviation from Population Data
To calculate the standard deviation from population data in excel, we should use STDEVP/STDEV.P/STDEVPA. You can see the general writing form of those three formulas below.
= STDEVP / STDEV.P / STDEVPA ( number1 , [number2] , … )
We combine the writing form of those three formulas into one because they are similar. We just need to write the formula name before inputting the numbers we want to calculate the standard deviation from.
You can input the numbers by typing them directly, using cell coordinates, or using cell ranges. Don’t forget to add commas ( , ) if you give more than one inputs.
If you use STDEVP or STDEV.P, then you should get similar results. If you use STDEVPA, however, then you can get a different result if there are logic values or text. That is because STDEVPA involves them in its standard deviation calculation while the other two formulas ignore them.
You can see the implementation examples of those three formulas to calculate the same population data in excel below.
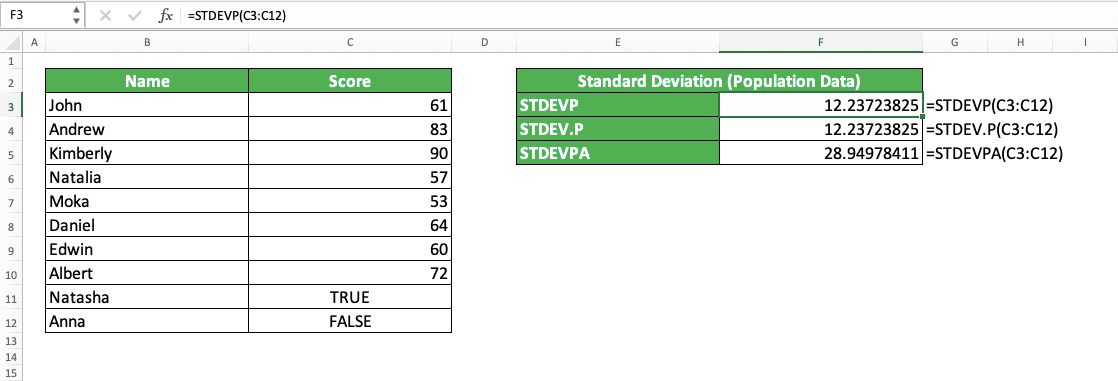
We assume the data in the screenshot as population data. As you can see, the writing of STDEVP, STDEV.P, and STDEVPA are almost the same. The only difference there is in the formula name we use.
You can also see that the results for STDEVP and STDEV.P there are the same while STDEVPA is different. That is because there are two logic values in our population data. If there aren’t logical values or text, then the three formulas will produce the same results.
How to Use Standard Deviation Formulas in Excel to Calculate Standard Deviation from Sample Data
What if the data we have is sample data? How should we calculate the standard deviation from them in excel?This is when we should use the other three standard deviation formulas in excel, STDEV, STDEV.S, and STDEVA. The writing form of these three is similar to the standard deviation formulas for population data, as you can see below.
= STDEV / STDEV.S / STDEVA ( number1 , [number2] , … )
Just write the formula name you want to use and input the numbers you want to calculate the standard deviation from!
>One thing to determine when choosing the formula to use is whether you want to ignore/involve logical values and text. STDEV and STDEV.S ignore them while STDEVA involves them in its calculation.
To understand how to use those three formulas easier, here is their implementation example in excel.
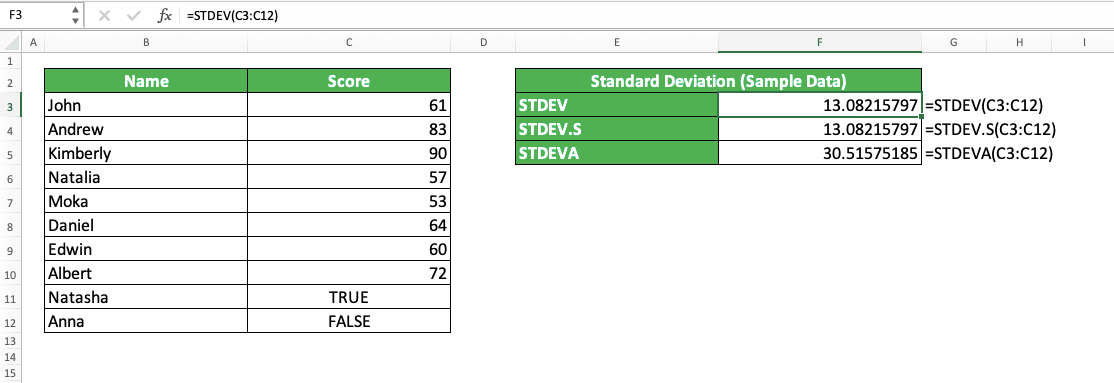
We use the same data as the one we use for the standard deviation calculation example for population data. However, here, we assume the data as sample data.
As you can see, the results from STDEV and STDEV.S are the same while STDEVA is different. That is because STDEV and STDEV.S ignore logic values and text while STDEVA involves them in its calculation. Just like the case for STDEVP, STDEV.P, and STDEVPA in the population data calculation.
Choose the right formula for your standard deviation calculation in excel and you will get the right result!
How to Calculate Weighted Standard Deviation in Excel
The data you want to calculate the standard deviation from may have a different weight for each. Some data probably give more contribution to the calculation than the others.If that is your situation, then you cannot use a built-in excel formula to calculate the standard deviation. That is because the standard deviation formulas in excel don’t have weights as a part of their inputs. You need to calculate manually although you still use some excel formulas such as SUM, SUMPRODUCT, and SQRT to help you.
First, we need to calculate the weighted mean of our data. The way to do that calculation is by writing this kind of formula.
= SUMPRODUCT ( number_range , weight_range ) / SUM ( weight_range )
We use SUMPRODUCT and SUM help for this.
As in a normal mean calculation, we should sum our numbers before dividing the sum result with the number of numbers. However, since we have weights here, we should involve them too.
We use SUMPRODUCT to multiply each of our numbers with its weight before adding the results. Next, we divide the SUMPRODUCT result with the SUM result of our data weights.
After we get the weighted mean, we can calculate our weighted standard deviation. There are two methods to do that depending on whether our data represents population or sample data.
Here is the general writing form to get the standard deviation if we have population data.
= SQRT ( SUMPRODUCT ( ( number_range - weighted_mean ) ^ 2 , weight_range ) / SUM ( weight_range ) )
And here is the general writing form to get the standard deviation if we have sample data instead.
= SQRT ( SUMPRODUCT ( ( number_range - weighted_mean ) ^ 2 , weight_range ) / SUM ( weight_range ) - 1 )
We follow the way to write a standard deviation formula here and translate it into our formula writing in excel. The only difference between the formula writing for population and sample data is the -1 existence behind.
We subtract each of our numbers with the weighted mean we just calculated and square each of the subtraction results. We multiply each square result after that with the data weight. We use SUMPRODUCT to do all of these calculation processes.
After that, we divide the result with the SUM of our weights. We add -1 there depending on whether we calculate population or sample data. After that, we square root the result using SQRT to get our standard deviation value.
To see the implementation of this whole explanation, here is a weighted standard deviation calculation example in excel.
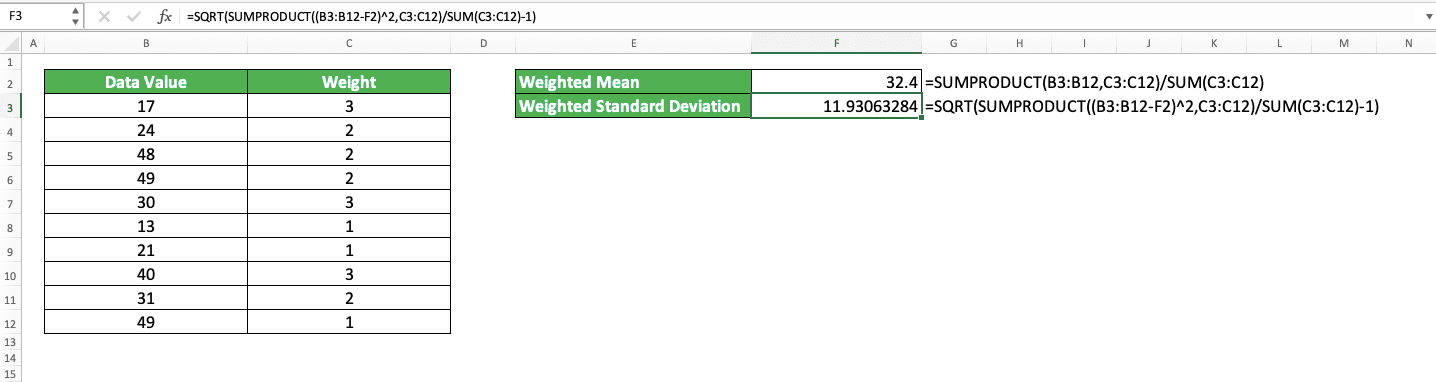
We assume the data we have in the example to be sample data. Because of that, as you can see, we add -1 in our formula writing to get the weighted standard deviation value.
We calculate the weighted mean first using the combination of SUMPRODUCT and SUM. After that, we use the weighted mean in our calculation to get the weighted standard deviation.
Write the formulas correctly and you will get the statistical value you need!
How to Calculate Standard Deviation in Excel with an IF criteria
Have some criteria to filter the data entries which values you want to calculate a standard deviation from? Excel also has formulas for that, which are DSTDEV and DSTDEVP. The difference between the two formulas is DSTDEV calculates sample data while DSTDEVP calculates population data.Here is the writing form of both DSTDEV and DSTDEVP in excel.
= DSTDEV / DSTDEVP ( database , field , criteria )
To use DSTDEV or DSTDEVP, you need to place your data entries and criteria in the form of tables with headers. Both formulas will use those headers to see where they should get the numbers to calculate the standard deviation from. They also use the headers to evaluate your data entries with your criteria.
Here is a bit explanation of the inputs you need to give to the formulas.
- Database: the cell range where the data entries with the numbers you want to calculate the standard deviation from are. Must include headers.
- Field: the header of the database table where the numbers you want to calculate the standard deviation are. You can input either the header field index (in number) or the header name (in text) here.
- Criteria: the cell range where your criteria are. Must include headers that match your database headers. Can have multiple rows and columns to support multiple criteria
For the criteria input, excel will treat multiple criteria in different rows using the OR logic (TRUE if at least one of them is TRUE). For multiple criteria in different columns, it will use the AND logic to evaluate (TRUE if all of them are TRUE). DSTDEV and DSTDEVP will calculate the standard deviation only for the numbers in which data entries fulfill the criteria.
For the criteria writing in your criteria table, you can write them using the writing forms like below.
Text (not case-sensitive)
| Criterion Example | Explanation |
|---|---|
| Jim | The same as “Jim” |
| <>Jim | Not the same as “Jim” |
| Jim* | With “Jim” prefix |
| *jim | With “jim” suffix |
| J*m | “J” prefix and “m” suffix |
| Jim? | “Jim” prefix with any one character suffix |
| ?jim | Any one character prefix with “jim” suffix |
| J?m | “J” prefix, any one character, and “m” suffix |
| Jim~* | The same as “Jim*” |
| Jim~? | The same as “Jim?” |
A bit explanation of the symbols used in some text criteria:
- * = any character with any amount
- ? = any one character
- ~ = used when you want to add * or ? character for the criterion
Number
| Criterion Example | Explanation |
|---|---|
| 70 | Equal to 70 |
| >70 | More than 70 |
| <70 | Less than 70 |
| >=70 | More than or equal to 70 |
| <=70 | Less than or equal to 70 |
Date
| Criterion Example | Explanation |
|---|---|
| >3/12/2009 | Later than 3 December 2019 |
Cell coordinate
| Criterion Example | Explanation |
|---|---|
| =“>”&B1 | More than the value in B1 |
Empty/non-empty
| Criterion Example | Explanation |
|---|---|
| Empty | |
| <> | Not empty |
To better understand the DSTDEV/DSTDEVP implementation to calculate the standard deviation with an IF criteria, here is an example.
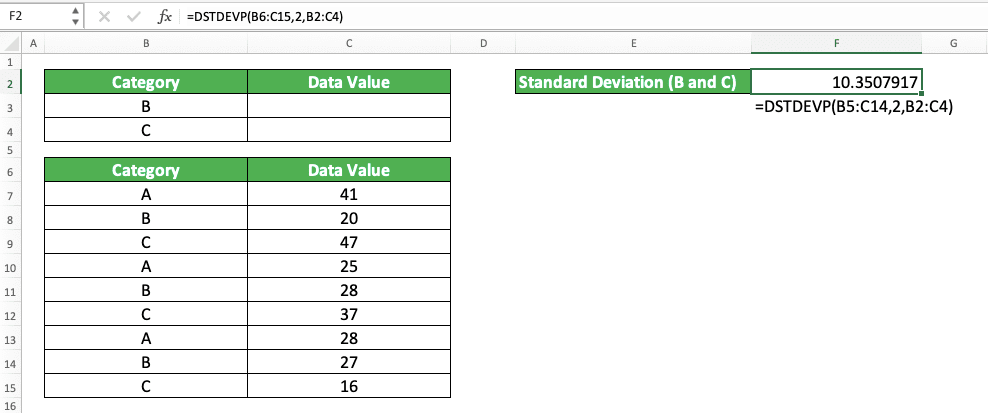
In the example, you can see how we should organize our database and criteria input for DSTDEV/DSTDEVP. We use DSTDEVP here because we assume that the data represents population data. If your data is sample data, then you just need to change the DSTDEVP in the formula writing there to DSTDEV.
For the field input, we can input the field index or the field header name of our numbers. Here, because the numbers we want to calculate in our database are in the second column, we input 2. We can also input “Data Value” (the header name) there and the result will be the same.
Meanwhile, for the criteria input, you need to make a table with the same headers as your database input. Put the criteria you have for your data entries in the appropriate fields.
In the example, we have B and C categories as our criteria. Thus, we input the B and C in the category column of our field table, one category per row.
As a result of the formula writing in the example, we get the standard deviation for the B and C categories!
How to Calculate the Standard Error of the Mean in Excel
Standard error of the mean measures the difference our sample data mean has to the population mean. The smaller the value, the closer our sample mean is to the population mean. That means we can be more confident that our sample data represent the population well.We can get this standard error by dividing the standard deviation by the square root of our data amount. To implement that formula in excel, we can use STDEV/STDEV.S, SQRT, and COUNT formulas to help us. We use COUNT as we only need to count the number of numbers here, not to count other data types.
Here is the general writing form of the STDEV/STDEV.S, SQRT, and COUNT formulas combination to calculate the standard error.
= STDEV / STDEV.S ( number1, [number2] , … ) / SQRT ( COUNT ( number1, [number2] , … )
And here is the formula writing implementation example in excel.

We count the number of our numbers using COUNT before square root the result using SQRT. We use the SQRT result as the divider of our standard deviation, which we calculate using STDEV.S (or you can use STDEV if you want).
From there, we get that the standard error of the mean of the sample data in the example is 4.31. It is quite a big number which indicates that the sample data does not represent its population well.
Excel Variance Calculation & Formulas
Another statistical value we may need to calculate for our data is variance. Variance is the squared deviation of our data to its mean. It measures the variability that we have in our data.Variance has a quite similar meaning in statistics to standard deviation. Both measure the distribution of our data. It is only that variance is the squared version of the standard deviation value.
However, if you want to know the variance value of your data, then excel has special formulas for the calculation too. The excel variance formula variations are quite similar to its standard deviation formula variations.
Here is the list of variance formulas you can use in excel.
- VAR: the formula to calculate the variance of sample data by ignoring logical values or text if there is any.
- VAR.S: the formula to calculate the variance of sample data by ignoring logical values or text if there is any. VAR.S is a newer version of VAR (you can use VAR.S since excel 2010). They seem to have a similar function, although excel officially recommends using VAR.S instead of VAR.
- VARP: the formula to calculate the variance of population data by ignoring logical values or text if there is any.
- VARP.P: the formula to calculate the variance of population data by ignoring logical values or text if there is any. VAR.P is a newer version of VARP (you can use VAR.P since excel 2010). They seem to have a similar function, although excel officially recommends using VAR.P instead of VARP.
- VARA: the formula to calculate the variance of sample data by involving logical values or text if there is any. VARA assumes FALSE logic values and text as 0 and TRUE logic values as 1.
- VARPA: the formula to calculate the variance of population data by involving logical values or text if there is any. VARPA assumes FALSE logic values and text as 0 and TRUE logic values as 1.
Here is the implementation example of the six formulas on the same data in excel.
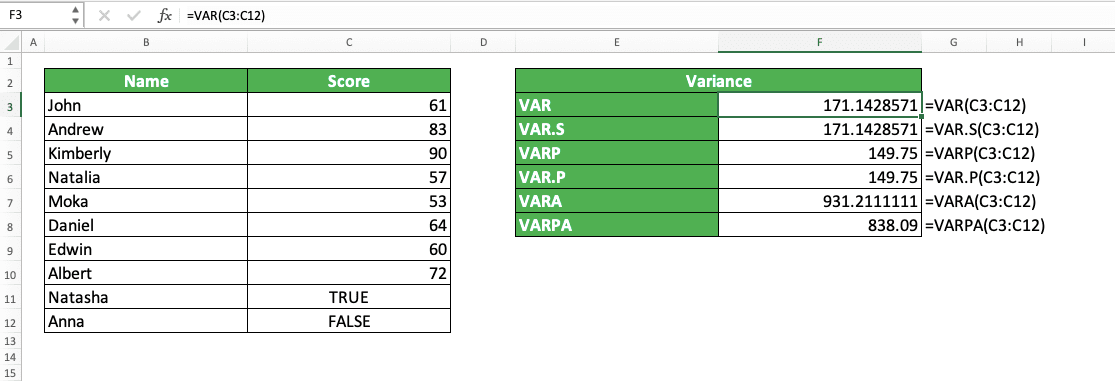
Use the formula which suits your data processing condition to get the correct variance value!
Alternatively, if you already know the standard deviation value, then you can just square it to get your variance value.
Exercise
After you have learned how to calculate standard deviation in excel, you can practice your understanding by doing this exercise!Download the exercise file and answer the questions. Download the answer key file if you have done the exercise and sure about the results!
Link to the exercise file:
Download here
Questions
- What is the standard deviation value if the data represents a sample?
- What is the standard deviation value if the data represents a population?
- What is the standard deviation if the data represents a sample? For this question, you also need to include text and logical values in your calculation process.
Link to the answer key file:
Download here
Additional Note
For STDEVA and STDEVPA, each text and FALSE logic value is calculated as 0 and TRUE as 1. If you use those formulas, don’t forget to remove unneeded text and logic values in your cell range. You let one slip and it can cause mistakes in your calculation result!Related tutorials you should learn: